The L3 Plateau That Disappeared
Textbook cache-latency plots make memory look annoyingly well-behaved: grow the working set, and latency climbs through L1, L2, LLC, then DRAM. I tried to reproduce that staircase on my i5-12450HX with a dependent pointer chase and got something much uglier. The L3 plateau seemed to disappear way too early, and “probably just noise” was not a satisfying answer.
My Beautiful Machine⌗
My CPU was an Intel Core i5-12450HX. I ran the benchmark on logical CPU 7 and kept its SMT sibling, logical CPU 6, offline during the runs. The caches belong to the physical P-core, not to logical CPU. When both hyperthreads on a core are active, they issue loads and stores on the same L1 and L2 thus potentially evicting lines for each other. Thus, the SMT sibling needs to be offline.
System summary:
| Category | Value |
|---|---|
| CPU | Intel Core i5-12450HX |
| Core topology | 4 P-cores + 4 E-cores, 12 threads |
| Measurement CPU | P-core, logical CPU 7 |
| SMT sibling | logical CPU 6, kept offline |
| L1D [P-core] | 48 KiB, 12-way, 64 B line |
| L2 [P-core] | 1.25 MiB private, 10-way |
| LLC | 12 MiB shared, 8-way |
| Kernel | 7.0.11-zen1-1.1-zen |
| Compiler | g++ 16.1.1 |
| Frequency policy | performance governor, turbo disabled |
| Pages tested | 4 KiB, THP-requested, explicit 2 MiB huge pages |
The P-core cache numbers are the relevant ones here because the benchmark was pinned to a P-core. The E-core cache arrangement is different, but it is not part of this measurement path.
Precautions and Setup⌗
Before any of this is worth trusting, I had to do a lot of isolation and cleaning to keep the noise down.
The Compiler⌗
Microbenchmarks are easy to accidentally optimize into nonsense, so the chase loop has to remain a real dependency chain and the final pointer has to stay live. Each load produces the address of the next load, and I also escape the final pointer through an empty inline-asm block so the compiler cannot treat the loop as dead code.
  ChaseNode* current = head;
  for (std::uint64_t i = 0; i < iterations; ++i) {
    current = current->next;
  }
  asm volatile("" : "+r"(current) : : "memory");
The OS⌗
The OS can do a lot of shenanigans to destroy my measurements.
It can pre-empt my program or migrate it to some other core, so I pinned my program to logical core 7, offlined its SMT sibling logical CPU 6, forced the performance governor, and disabled turbo. How I achieved this can be found in the repository scripts here. I still repeated the experiment at least 30 times and used median as a hedge.
The hardware⌗
Timing short regions on x86 is its own small circus. I bracketed the chase loop with lfence; rdtsc at the start and rdtscp; lfence at the end.
inline std::uint64_t tsc_start() {
  _mm_lfence();
  const std::uint64_t t = __rdtsc();
  _mm_lfence();
  return t;
}

inline std::uint64_t tsc_stop() {
  unsigned int aux = 0;
  _mm_lfence();
  const std::uint64_t t = __rdtscp(&aux);
  _mm_lfence();
  return t;
}

//...

const std::uint64_t start = tsc_start();
chase_only_for_iterations(head, iterations);
const std::uint64_t stop = tsc_stop();
Even after this, there are extremely clever prefetchers that would render any logical access pattern into a more sequential one. To prevent that, I used random pointer chasing.
  const std::size_t count = std::max<std::size_t>(1, bytes / sizeof(ChaseNode));
  nodes_.resize(count);

  std::vector<std::size_t> order(count);
  std::iota(order.begin(), order.end(), 0);

  if (order_kind == ChaseOrder::Random) {
    std::mt19937_64 rng(0xCACE'CA11ULL ^ static_cast<std::uint64_t>(bytes) ^ seed_salt);
    for (std::size_t i = order.size(); i > 1; --i) {
      std::uniform_int_distribution<std::size_t> dist(0, i - 1);
      std::swap(order[i - 1], order[dist(rng)]);
    }
  }

  for (std::size_t i = 0; i < order.size(); ++i) {
    const std::size_t current = order[i];
    const std::size_t next = order[(i + 1) % order.size()];
    nodes_[current].next = &nodes_[next];
  }
| Knob | Value |
|---|---|
| Node size | 64 B, one pointer-sized node padded to one cache line |
| Ring coverage | One node per cache line across the requested working set |
| Sample | One independently rewired and timed pointer-chase run at a fixed configuration |
| Random seed | Deterministic per sample: 0xCACECA11 ^ bytes ^ seed_salt |
| Baseline warmup | 100000 dependent loads before timing |
| Baseline measurement | 5000000 dependent loads per sample |
| ROI PMU warmup | Usually 20 full ring traversals before enabling counters |
| ROI PMU measurement | Usually 10 full ring traversals with counters enabled |
| Repetitions per point | 30 for the main plotted sweeps unless stated otherwise |
| Aggregation | Median cycles/access is the headline number |
| Error bars | p10-p90 interval where shown |
With the ritual purification done, here was the first sweep.
The First Plot Did Not Cooperate⌗
This baseline sweep used fresh allocations per working-set size, with normal 4 KiB pages, 30 repetitions per point, and median cycles/access as the headline number.
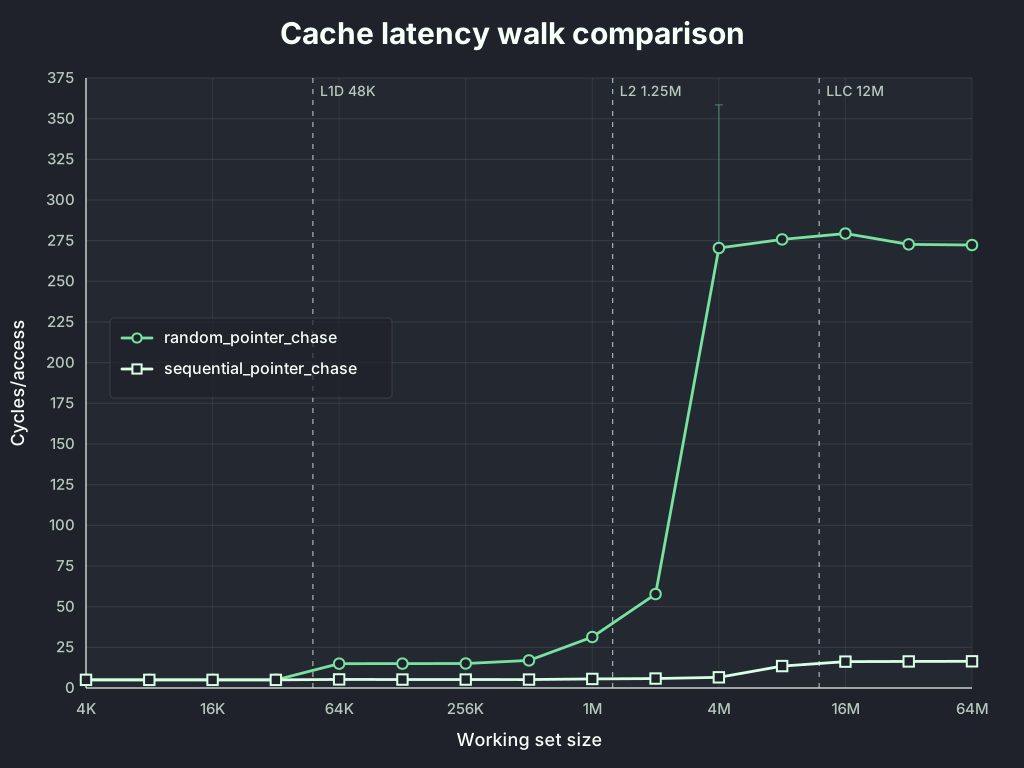
The L1 and L2 regions are pretty clear. The sequential chain stays low because it is a weak latency probe: it gives the hardware a predictable stream. The random dependent chain is the meaningful curve here. It serializes the load stream because each address depends on the previous load result.
That was exactly why I wanted it. The benchmark should expose the latency ladder more directly.
The problem was not just “no neat plateau.” The random dependent curve started climbing around 4 MiB and was already near 200 cycles/access by 8 MiB, which is uncomfortably early for a 12 MiB shared LLC.
At this point I did not know whether the benchmark was bad, the graph was misleading, the CPU was doing something subtle, or I had misunderstood the mental model. The first obvious suspect was translation overhead: random pointer chasing over a lot of small pages is exactly how you make a TLB miserable.
Maybe It Was TLB Pressure⌗
Random pointer chasing over a lot of 4 KiB pages is a good way to stress the TLB as well as the data cache. If translation overhead is doing most of the damage, larger pages should help because each TLB entry covers more memory and page walks become rarer. So I reran the sweep with three page modes: plain 4 KiB pages, THP-requested mappings, and explicit 2 MiB huge pages.
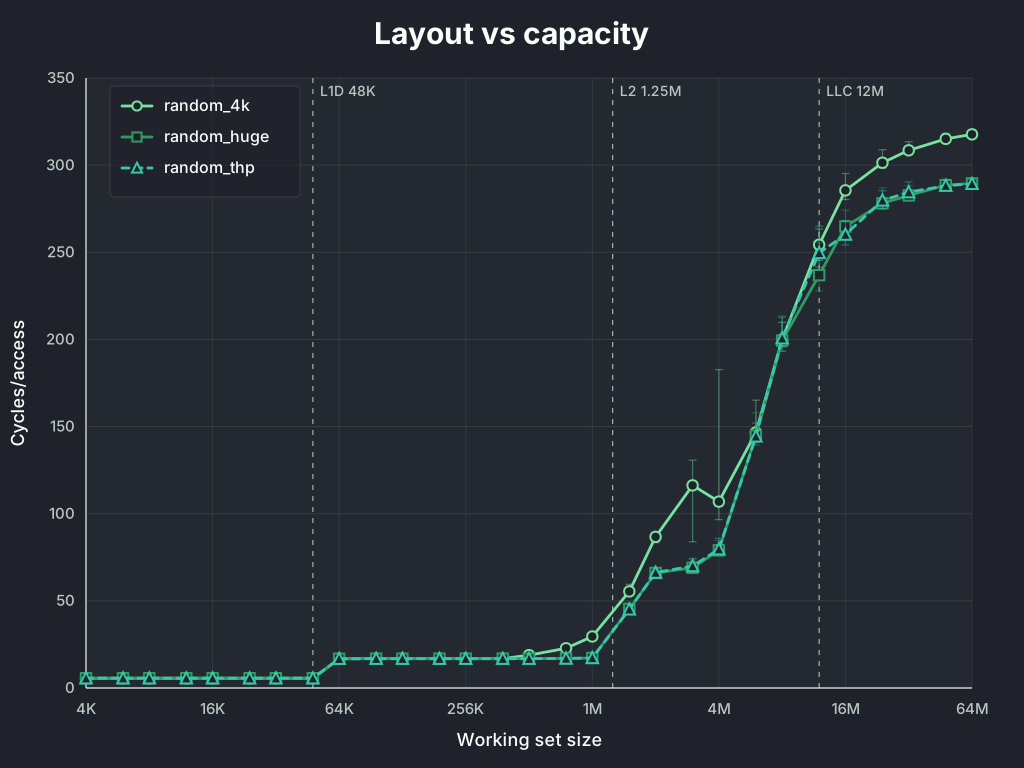
So, huge pages did help but not in the way I expected. It did flatten out the curve but only on the top end! It reduced the latencies but did not change the shape of the curve and I was still stuck with the cliff.
So if the problem was not mostly translation overhead, the next suspect was placement.
Maybe It Was Offset Weirdness⌗
Maybe my benchmark was hitting some weird aliasing problem causing it to thrash in the LLC. So, I tried sweeping the virtual offset of the pointer chase. The idea was that if some offsets were unlucky, I could find a better one and see a plateau.
I allocated a chunk of size working_set + max_offset and shifted the chase start across the offset range.
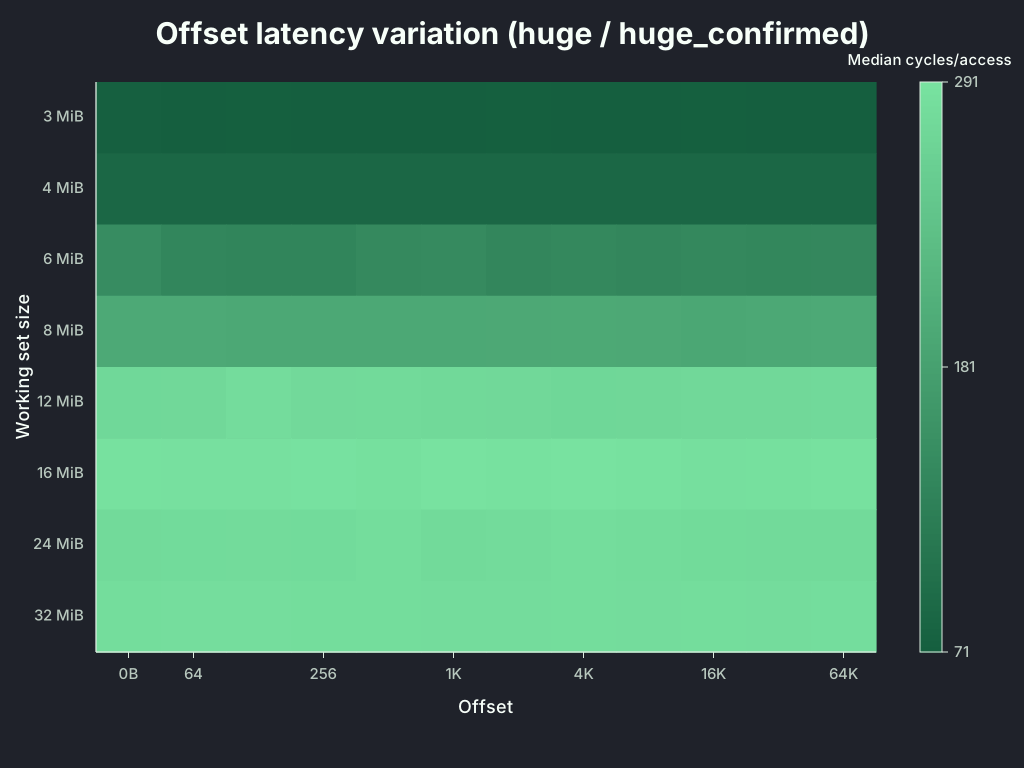
I saw some noise in the 3–8 MiB offset sweep, but the actual ratios were tiny — 1.00x to 1.03x across every size and mode I tested. So, it’s fair to conclude that this is just noise and nothing more.
| Size | Mode | Offset pair | Cycle/access Medians | Ratio |
|---|---|---|---|---|
3 MiB | 4 KiB | 1024 vs 8192 | 76.11 vs 76.00 | 1.00x |
3 MiB | huge | 64 vs 2048 | 69.62 vs 69.74 | 1.00x |
8 MiB | 4 KiB | 128 vs 32768 | 229.09 vs 231.07 | 1.01x |
8 MiB | huge | 1024 vs 65536 | 216.14 vs 210.84 | 1.03x |
8 MiB | THP-requested | 1024 vs 16384 | 212.26 vs 207.37 | 1.02x |
As you see, the differences were small and definitely not enough to explain the massive jumping cliff.
Latency Was Not Enough⌗
So far, I have been relying on latency only to get my answers but I realized that I need to get my hands dirty and look at the PMU counters to get a better picture of what is going on.
Cycles per access can tell me that something got slower, but it does not say why. The benchmark would warm the chain, start counters, run the chase, stop counters, and normalize by the number of dependent loads. I didn’t need everything — just a few key metrics:
- L2 miss event:
l2_rqsts.demand_data_rd_miss - L3 hit event:
mem_load_retired.l3_hit - L3 miss event:
mem_load_retired.l3_miss - DTLB walks:
dtlb_load_misses.walk_completed
I reset these counters before every run. To compute per-access values, I used:
dependent_loads = #nodes in the pointer chase * iterations
L2 miss/access = l2_rqsts.demand_data_rd_miss / dependent_loads
L3 hit/access = mem_load_retired.l3_hit / dependent_loads
L3 miss/access = mem_load_retired.l3_miss / dependent_loads
Once I had ROI counters, the mystery got sharper. One explicit-huge sweep looked like this:
| Size | Cycles/access | L2 miss/access | L3 hit/access | L3 miss/access |
|---|---|---|---|---|
3 MiB | 93.12 | 0.992517 | 0.805861 | 0.187899 |
4 MiB | 186.89 | 0.994819 | 0.366281 | 0.627930 |
5 MiB | 240.00 | 0.996566 | 0.144992 | 0.851131 |
7 MiB | 262.05 | 0.997888 | 0.017357 | 0.979984 |
8 MiB | 240.75 | 0.998416 | 0.105952 | 0.892009 |
12 MiB | 178.67 | 0.998891 | 0.353601 | 0.645162 |
So, the cliff appears because there is a rapid increase in L3 misses, and the measured latency is the average of a mix of hits and misses. The L3 miss fraction was jumping much earlier than I expected for a usable LLC regime. So, something is making the L3 miss fraction jump very early.
I noticed that on some of the runs, 12 MiB had a lower (though still very high) L3 miss fraction than 8 MiB. That was a hint that the working set size alone was not the only variable. Something else was at work. It could have been other processes interfering, since the LLC is shared across cores. But the same pattern repeating across runs made me suspicious of something simpler.
That suggested a new missing variable: it is not just how much memory I touched, but which physical pages I got.
False Hope⌗
Then I ran an experiment that seemed like a turning point. In one version, each working-set size got a fresh allocation. In the other, I allocated one larger buffer and measured prefixes of that same backing: first 3 MiB, then 4 MiB, then 5 MiB, and so on. Same pointer-chase logic, same page mode, same PMU setup; only the backing strategy changed.
The result:
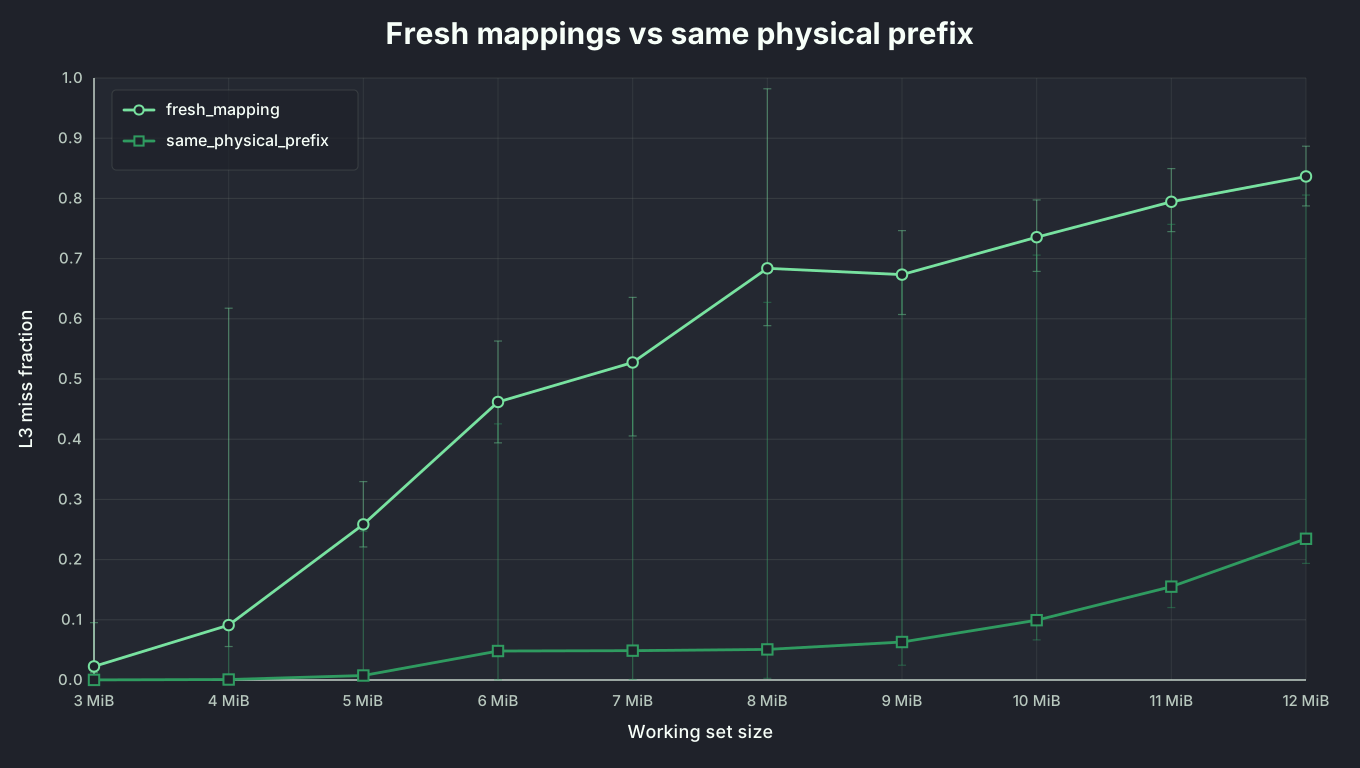
This was the first result that really broke the “size alone explains the cliff” model. The fresh-allocation runs picked up L3 misses much earlier, while prefixes of one fixed backing stayed well-behaved for longer. So working-set size was not the only variable anymore.
Just for my own sanity, I rebooted the machine once again and re-ran the experiment…
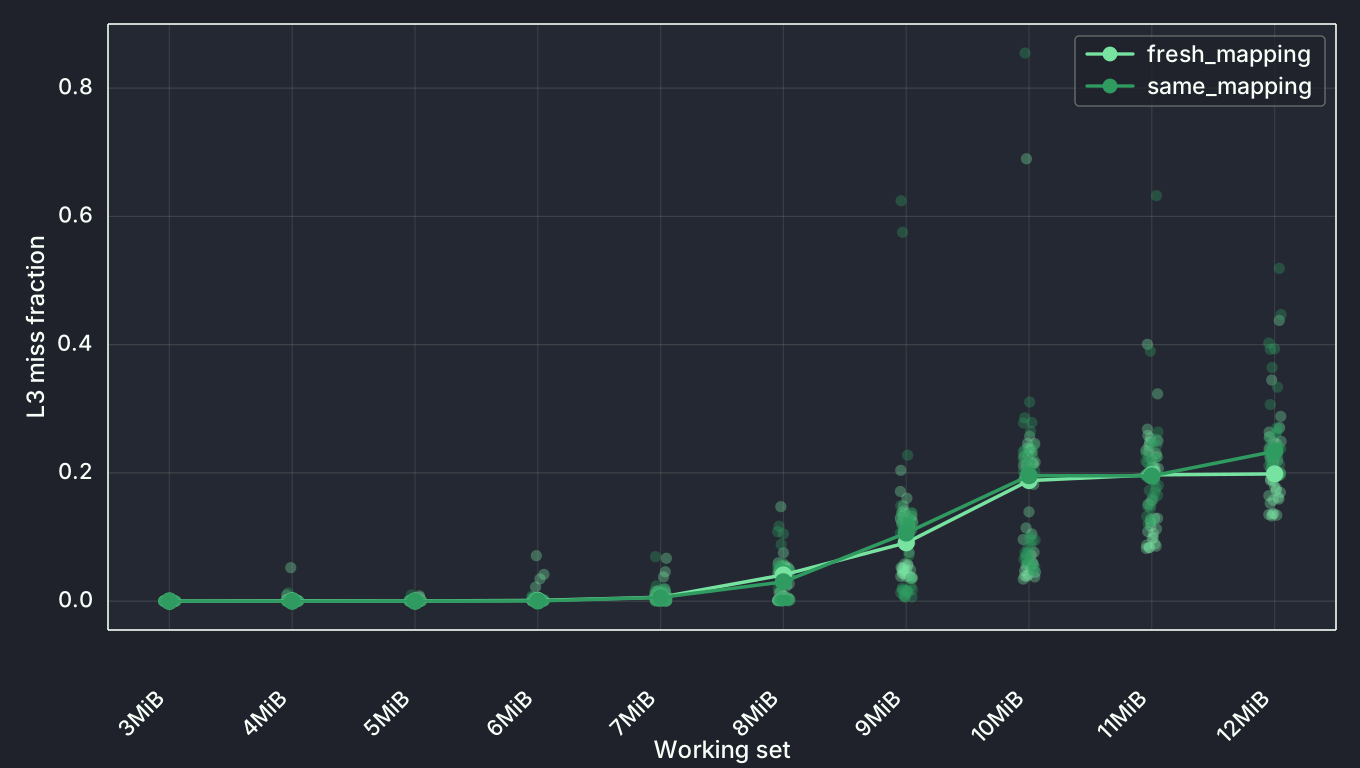 Now, there seems to be absolutely no difference at all between the two! I ran the experiment a couple of times and the results got worse in terms of higher miss fraction but there seemed to be little to no gap between the two!
So, it is not the fresh vs same mapping prefix. However, I noticed another trend. Whenever I ran the experiment directly after boot, both showed significantly lower L3 misses up to 10 MiB at the very least.
So, just to check, I decided to do the following:
I rebooted again, disabled the prefetchers, allocated one explicit 32 MiB HugeTLB-backed region, and measured prefixes of that same mapping.
Reboot and Redemption⌗
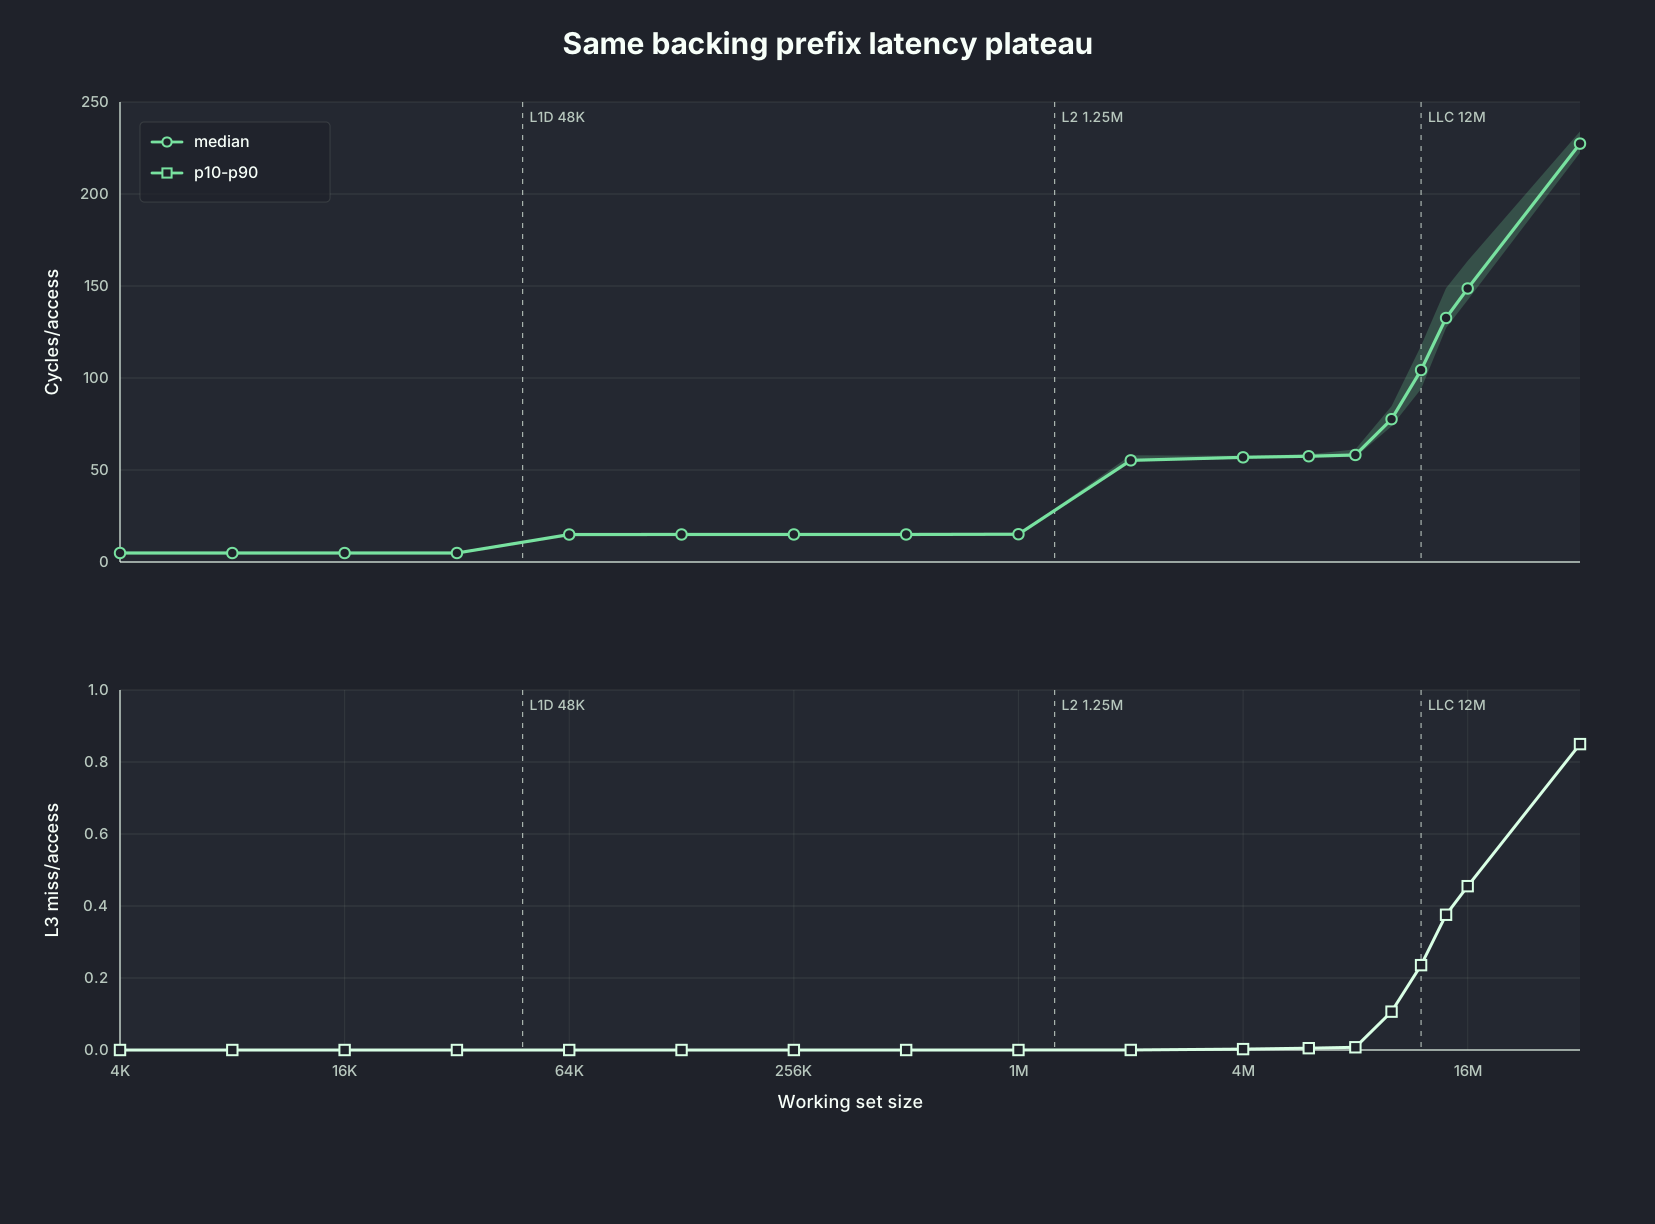
There it is — the plateau. From roughly 2 MiB to 8 MiB the curve stays low and flat before it starts climbing.
It does start rising a little before the actual 12 MiB LLC capacity, which is probably just the live OS sharing the cache with everything else on the machine — evicting my lines as my working set gets close to the full LLC size.
Now, I am curious about this:
Why the heck was this not seen in the first experiment?
The previous section showed that backing strategy did not produce the split I was looking for. That left two plausible variables: post-boot memory state and prefetcher state. Immediately after a reboot, the allocator might hand the benchmark relatively uncontended physical memory because most of it is still unused, producing a cleaner spread across cache sets. I could not prove that yet.
So, I decided to focus on prefetcher state.
Maybe It Was The Prefetchers⌗
This was a nice suspect because it sounded plausible and required only one knob to test.
Even though this was a dependent random pointer chase, CPUs are annoying enough that I did not want to just say “random means no prefetching” and move on.
So I ran paired tests on the same mappings:
prefetch ON -> prefetch OFF -> prefetch ON
The point was simple. If prefetchers were responsible for the missing plateau, turning them on and off should move the result in one consistent direction.
Welp. It did not.
The sign kept changing across mappings. At the same size, prefetchers sometimes made things slower and sometimes made things faster. The medians leaned slightly toward “prefetchers hurt” in some runs, but the individual mappings did not obey that story.
The cleaner signal was in the offset-window pass with prefetchers disabled. Even with prefetchers out of the way, different 8 MiB windows inside a 32 MiB mapping still behaved very differently.
| Run | Fastest 8 MiB window | Slowest 8 MiB window | Spread |
|---|---|---|---|
| Run 1 | 54.62 cyc/access | 72.55 cyc/access | 17.93 |
| Run 2 | 54.11 cyc/access | 72.17 cyc/access | 18.06 |
| Run 3 | 54.52 cyc/access | 70.25 cyc/access | 15.73 |
| Run 4 | 54.27 cyc/access | 75.63 cyc/access | 21.36 |
That is too large to ignore.
If prefetchers were the main reason, disabling them should have made the mapping behave uniformly. But nope! Some windows still looked LLC-ish. Some still looked much worse.
So prefetchers were not the answer. They could disturb the measurement, but they were not deciding whether the plateau appeared.
So, I was kinda stuck here with no answers. But the spread in the 8 MiB window numbers made me want to stop trusting the median and actually plot every single run.
The Democracy Lies⌗
I repeated the previous experiment for the plateau but this time, I traced all the curves.
For each allocation trial, I allocated a fresh 32 MiB HugeTLB-backed mapping and measured the curve.
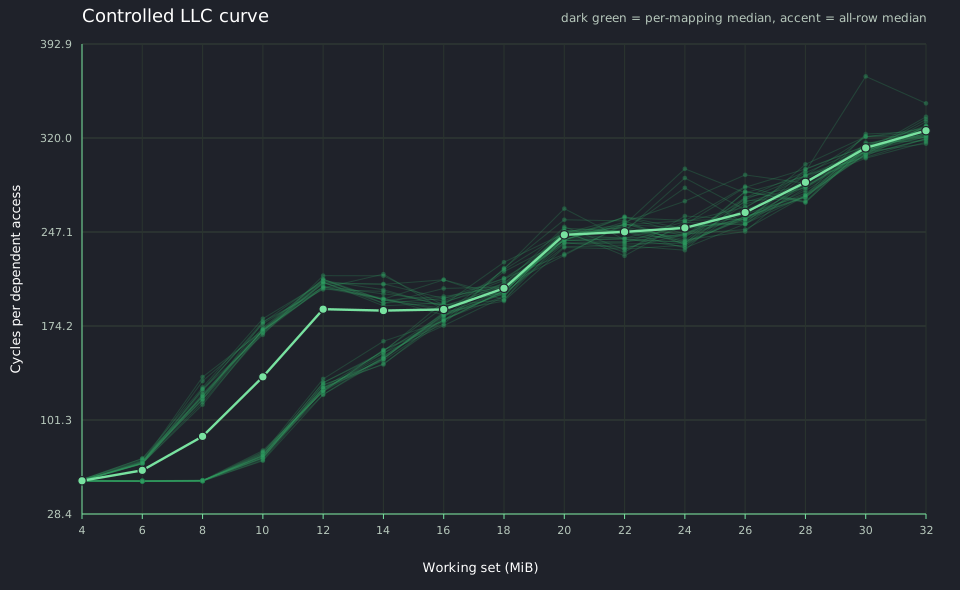
The lighter lines are the individual curves and bold line is the median curve. There seems to be 2 families of curves and median curve was hiding this from me.
One family stayed low, around 50-60 cycles/access, up to about 8 MiB, and then rose slowly. The other family climbed earlier and sat higher.
I tried to find what exactly differentiated these families.
The only difference that held up was that low curves had even chain seed + even mapping index while the higher ones seemed to have odd mapping + odd chain seeds.
Now, what is “mapping index”? Just the run number. 1st run is odd, 2nd is even and so on. And the chain seed is the random chain’s starting address ( I know it seems stupid to believe that the seed would have any effect at all but at this point, I was just too paranoid to discard anything tiny).
So, next obvious thing to do is find out if one of them is particularly responsible for the difference in families.
Cross-Examining the Suspects⌗
So to find the real culprit, I crossed them.
For each run, I used:
| Parameter | Value |
|---|---|
| Mappings | 16 |
| Chain seeds per mapping | 8 |
| Repetitions per mapping/seed pair | 3 |
| Sizes | 6, 8, 10, 12 MiB |
For each size, I treated mapping, seed, and their interaction as a small factorial design and estimated how much of the total variance each one explained. I used 50% as a rough cutoff for calling a term “dominant” at that size — not a formal significance test, just a way to see which knob mattered most. Very scientific of me, I know.
Three suspects, one lineup:
| Term | Meaning |
|---|---|
| Mapping | Some mappings are faster even after averaging over seeds |
| Seed | Some chain seeds are faster even after averaging over mappings |
| Interaction | A seed is good on one mapping and bad on another |
| Yes, I am know that ’the interaction term’ sounds like something a stats professor made up to fail me. It’s just ‘a seed can be lucky on one mapping and unlucky on another’. |
Each mapping/seed pair got 3 repetitions within a run, and I re-ran the whole comparison multiple times on top of that — mainly to make sure I hadn’t just gotten a lucky (or unlucky) patch of physical memory on any one attempt.
| Run | Mapping-dominant sizes | Seed-dominant sizes | Interaction-dominant sizes |
|---|---|---|---|
| Run 1 | 12 MiB | none | 6, 8, 10 MiB |
| Run 2 | 6, 8, 10, 12 MiB | none | none |
| Run 3 | 8 MiB | none | 6, 10, 12 MiB |
This killed almost all the explanations, but introduced a sharper problem: the three runs disagree with each other heavily.
Run 1 says 12 MiB is mapping-dominant and 6/8/10 MiB are interaction-dominant. Run 3 says 8 MiB is mapping-dominant and 6/10/12 MiB are interaction-dominant. Only Run 2 says everything is mapping-dominant. That is three runs of the same experiment producing three different stories about which sizes fall into which bucket, with only one thing reproducing cleanly across all runs: the seed never wins.
That leaves exactly one thing still invisible: the physical reality sitting behind each mapping index. Nothing past this point can be settled without looking at that directly instead of inferring it from a curve.
Where I Stopped⌗
Looking at it directly means logging the huge-page PFNs behind each mapping and checking them against (reverse engineered) Intel’s LLC slice-hash function. I’m not doing that here.
The reason that is that I have learned that every easy next step has led me down and down the rabbit hole. Earlier in the investigation, I burned more than 2 weeks of work on a false lead that didn’t even make it into this post. At some point, one more experiment stops being rigor and starts being a way to avoid writing the ending.
So here’s the actual ending I have:
The missing plateau was never missing. It was conditional: it showed up when the physical mapping and the chain order happened to line up, and my very first sweep averaged the runs where they lined up together with the runs where they didn’t, then treated the result like a single meaningful number.
That also explains the reboot effect from earlier. Right after boot, most of physical memory is still free, so the allocator has more room to hand out pages that happen to spread nicely across LLC sets — still mapping luck, just dressed up as a reboot effect. I haven’t checked that against actual PFNs, so treat it as a guess and not a result. But it’s the guess everything else here points to.
Which is exactly the check I said I wasn’t doing two paragraphs ago. So: next post.